Visualising the catastrophe bond market shift from aggregate to occurrence
One of the interesting trends seen in the catastrophe bond market through recent years and a clear reaction to loss activity experienced, is the shift away from aggregate cat bond coverage, back towards per-occurrence structures becoming the more dominant form seen.
We can visualise the gradual shift back, from aggregate reinsurance and retrocessional risks making up the largest share of the catastrophe bond market, to today when per-occurrence reinsurance and retro structures have become more popular.
Using Artemis’ range of catastrophe bond and insurance-linked securities (ILS) charts and visualisations, we can clearly see how this trend developed.
Investors suffered losses in catastrophe bonds and other insurance-linked securities (ILS) instruments due to aggregation across smaller catastrophe and severe weather events from 2017 on and this drove a shift in investor demand.
Changes were seen in how aggregate structures attached, as well as a shift away from franchise deductibles to event deductibles, and this together with reduced investor appetite for aggregates altogether in some quarters, has driven the cat bond market shift away.
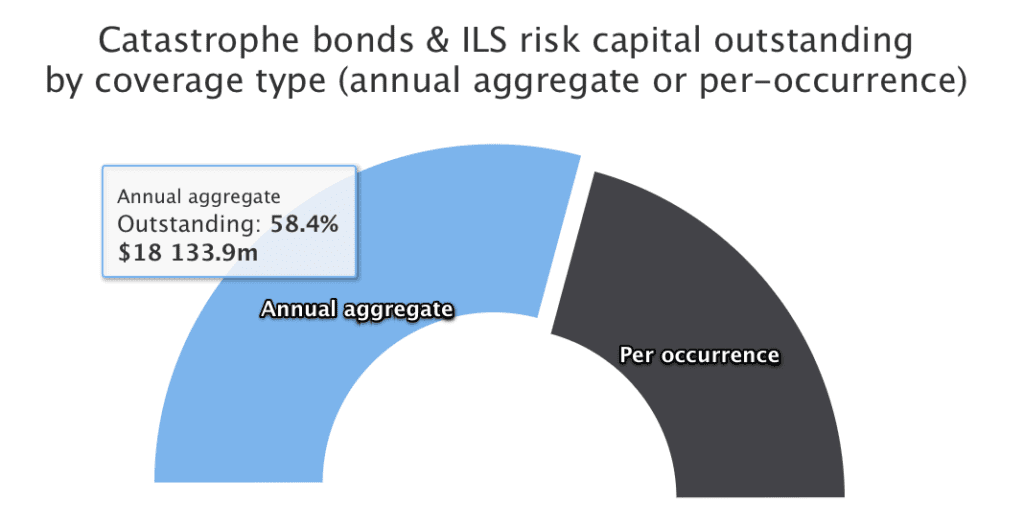
At one stage, the outstanding cat bond market was composed of almost 60% aggregate cat bond deals.
In March 2019 the market split, across aggregate and occurrence, looked like the below:
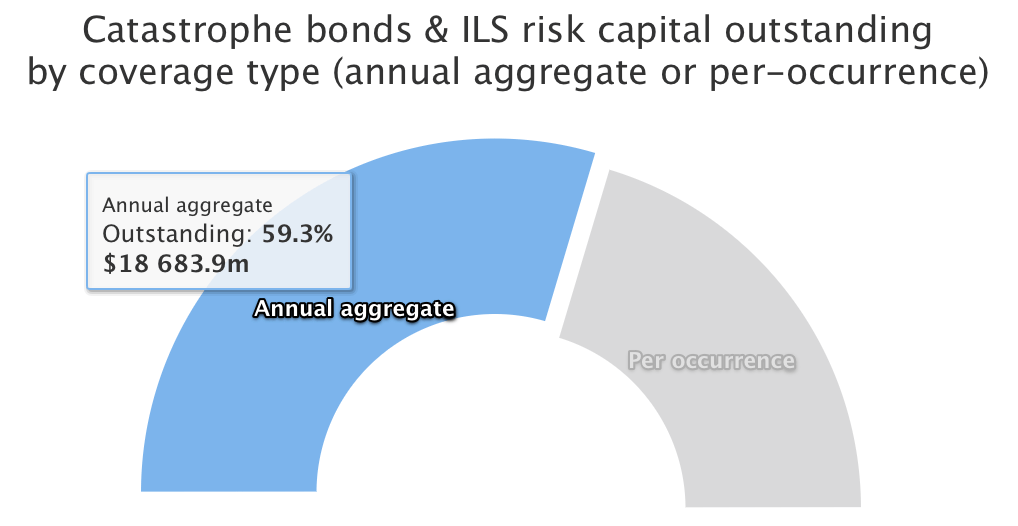
By September of that year, aggregate cat bonds had increased their share further, approaching the 60% mark, a figure it did reach for a short time a few weeks later, by Artemis’ data.
But, by a year later, in Q3 2020, things had begun to change, as more per-occurrence deals started to flow in the cat bond market and the needle was shifting back to the occurrence reinsurance and retro side, which was pleasing to investors.
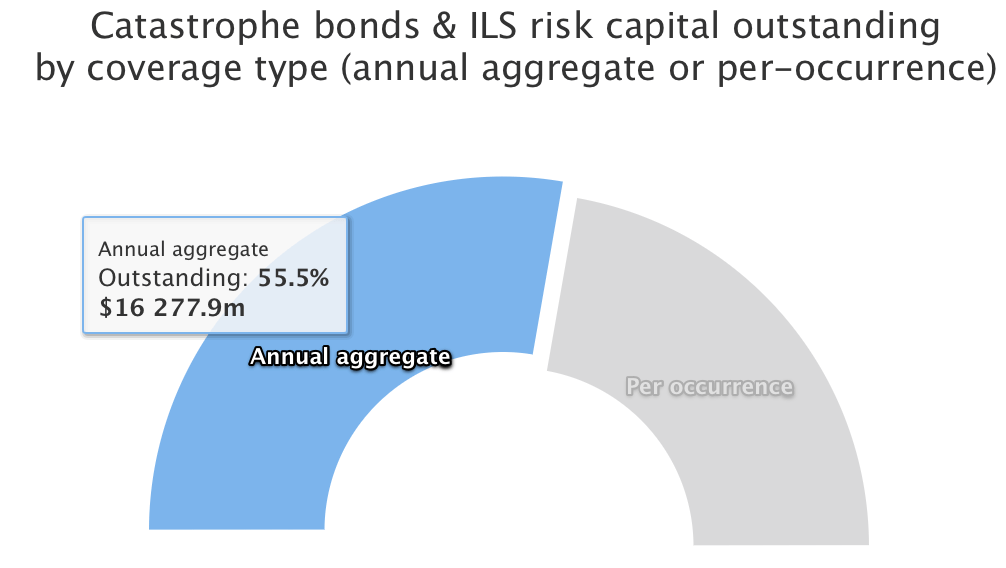
By March 2021, the shift was continuing, with aggregate cat bonds gradually becoming a lesser component of the outstanding cat bond market.
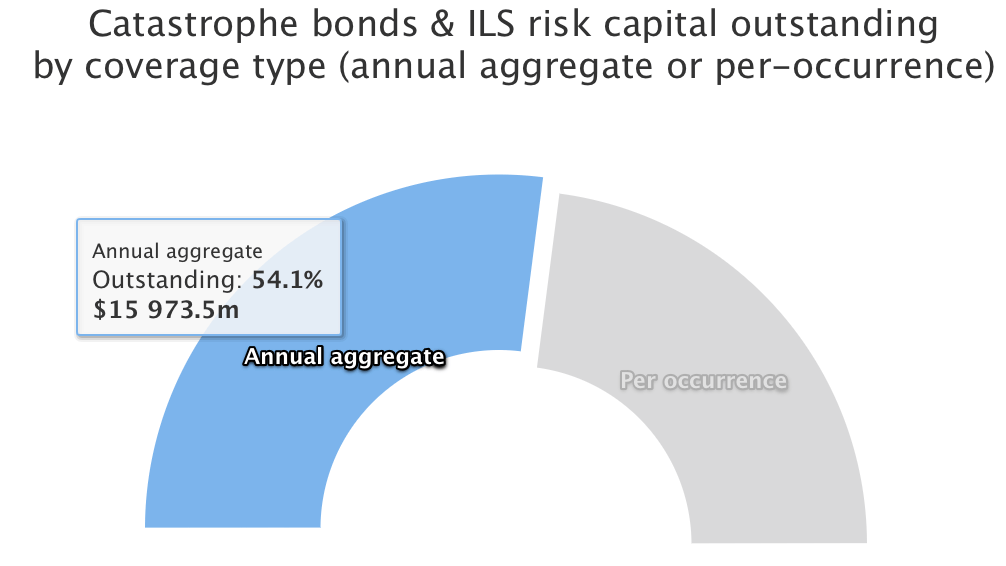
After a stronger period of issuance and also maturities, by June 2021 the market was becoming much more evenly split, with only just over half of the risk capital outstanding being exposed to aggregation.
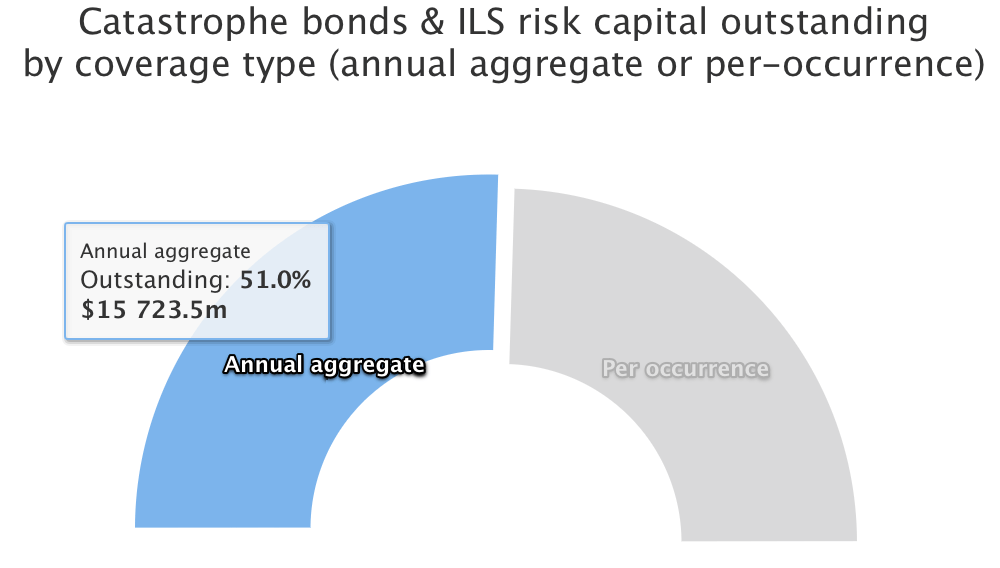
By November 2021 the shift was well underway and moving faster it seemed, as per-occurrence structures became the dominant component of the outstanding catastrophe bond market, according to Artemis’ data.
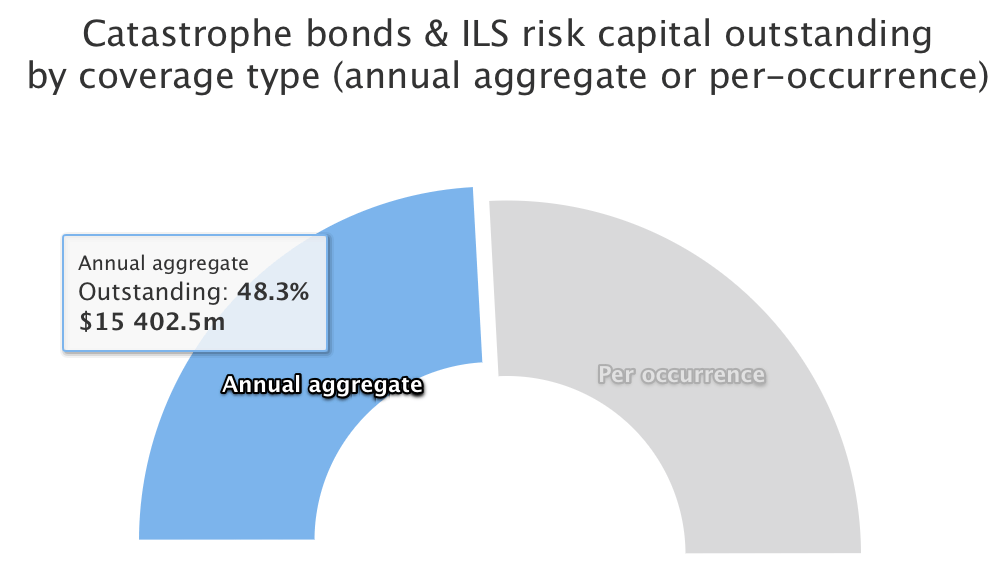
Another year on, by the start of Q4 2022 and things had plateaued for a time, with more aggregate structures with event deductibles starting to come to market and getting greater investor reception.
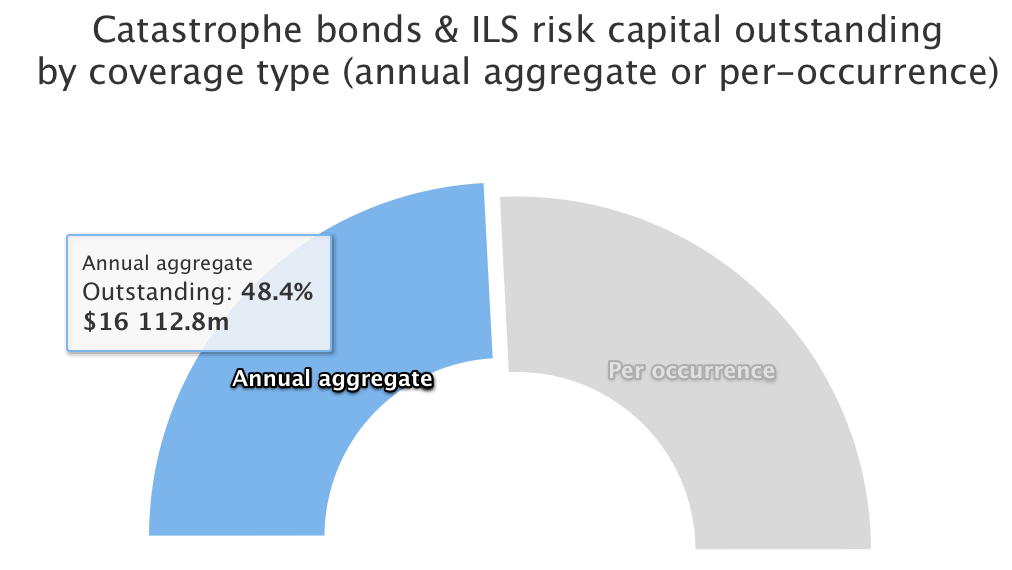
But then, with a hard reinsurance market ensuing, by the end of Q1 of 2023 the aggregate side of the cat bond market had begun to shrink again.
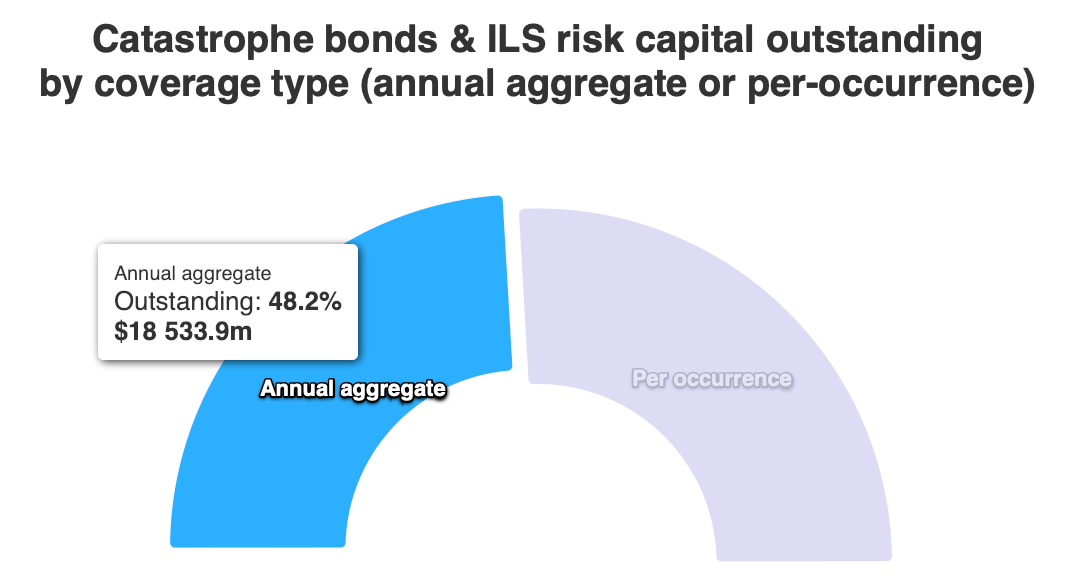
Which has now continued and by the start of June 2023 per-occurrence structures and coverage remains the largest component of the outstanding cat bond market, by our numbers.
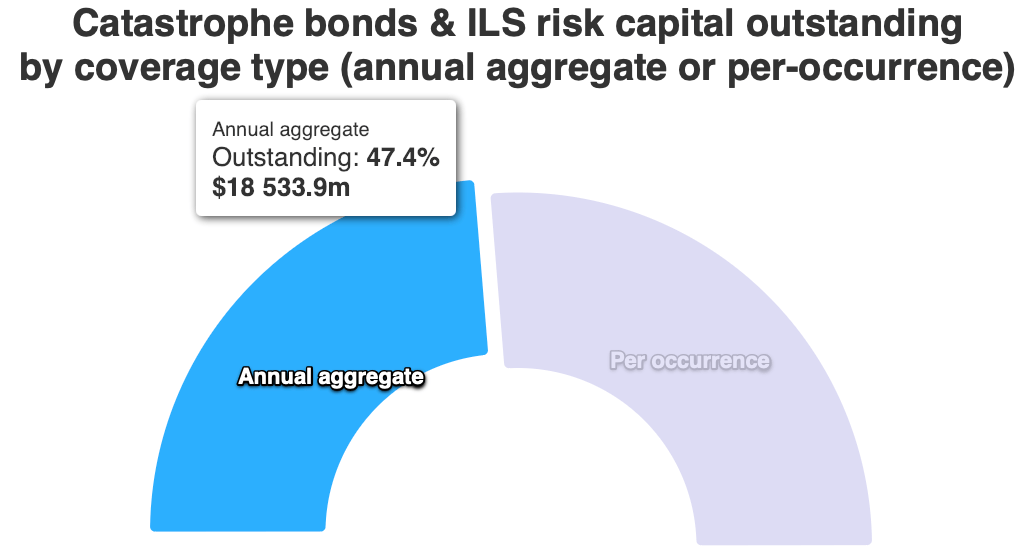
A fortnight later, the percentages remain the same, despite a glut of maturing bonds and some new issuances, it seems perhaps the catastrophe bond market is beginning to find a balance between aggregate reinsurance and retro structures and the now more popular per-occurrence cat bond notes.
Overall, there has been a roughly 13% shift, from around 60% aggregate and 40% occurrence, to just over 47% aggregate and almost 53% occurrence, since late 2019.
It will be interesting to see whether this remains the balance, or whether aggregate structures gain popularity again, as the sponsors clearly want that type of coverage still and the cat bond market is a viable source for it, on the right terms.
The data supporting our charts has been collected by Artemis over the 25 year period the catastrophe bond market has existed and is now supported by more than $150 billion of issuance, all of which is detailed in the Artemis Deal Directory.
You can access all of Artemis’ catastrophe bond market reports here and analyse our data using charts and visualisations here.


