Cat bonds break half-year issuance record at $10.9bn already for H1 2024
Issuance of new catastrophe bonds and related insurance-linked securities (ILS) has already reached $10.9 billion in 2024 and has now broken the record for the first-half, while the amount of cat bond and related ILS risk capital outstanding has reached another new high as the market continues to grow.
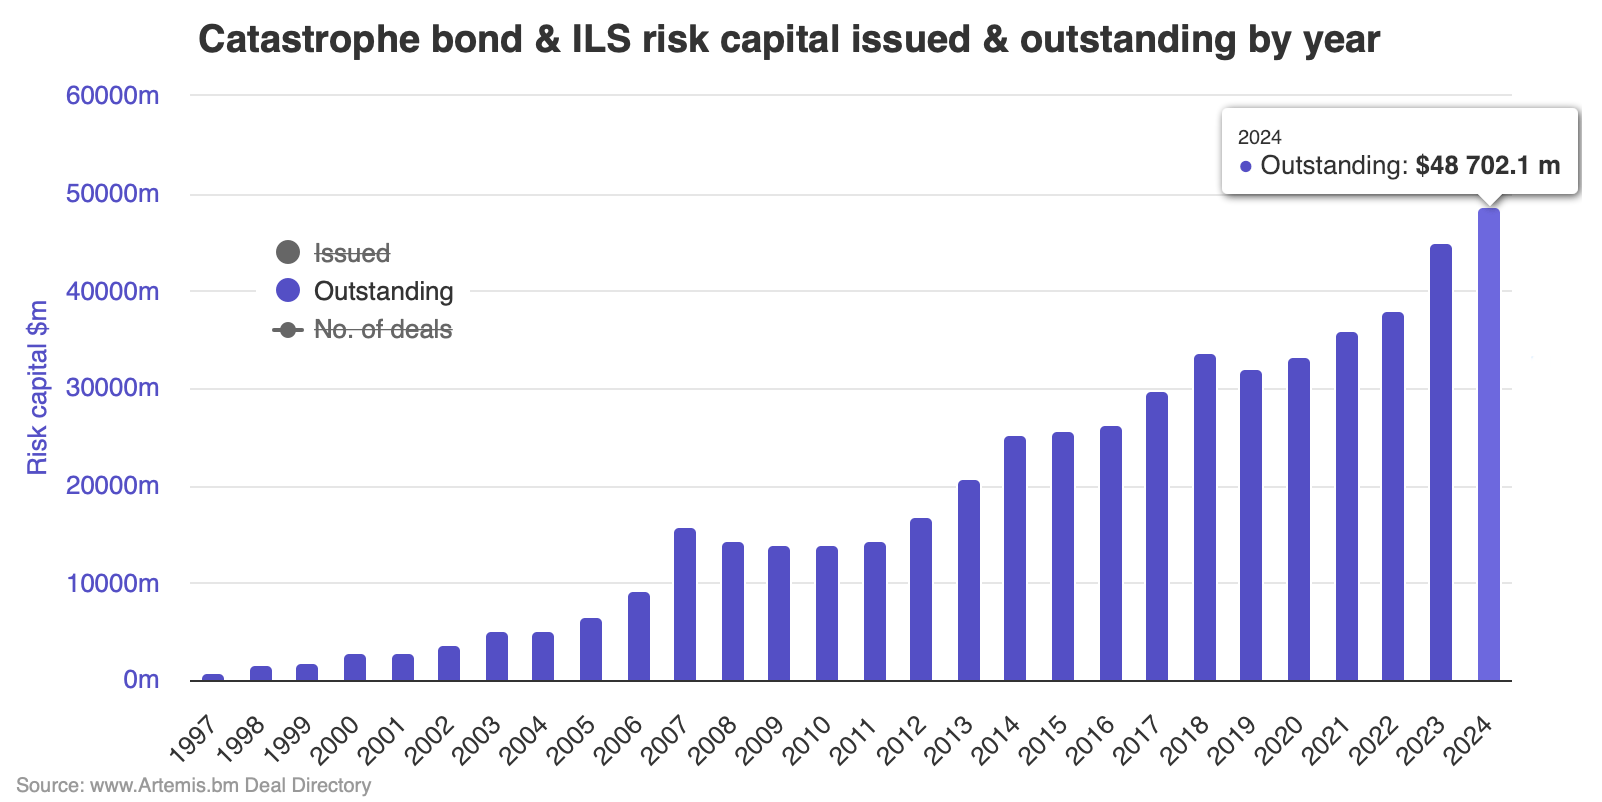
The outstanding market for catastrophe bonds and related insurance-linked securities (ILS) has now grown by more than 8% so far in 2024, reaching over $48.7 billion, based on data from Artemis’ Deal Directory and our range of interactive cat bond market charts.
Issuance year-to-date has now reached $10.9 billion, thanks to the settlement of the latest catastrophe bond from Florida Citizens later today.
That figure will surpass $11 billion later this week and risk capital outstanding will reach a landmark of more than $49 billion as a result.
The previous half-year record was $10.3 billion set in 2023, so we’re now well past that and the catastrophe bond market is on-track to set a very high H1 benchmark figure in 2024.
The growth of the catastrophe bond market and related ILS is driving significant opportunity for investors to deploy capital, with cat bond fund managers able to raise new funds and deploy cash earned from the strong returns the market has been generating.
While we’ve seen some fluctuations in price and spread volatility, things do remain relatively balanced with last year, Artemis’ data shows.
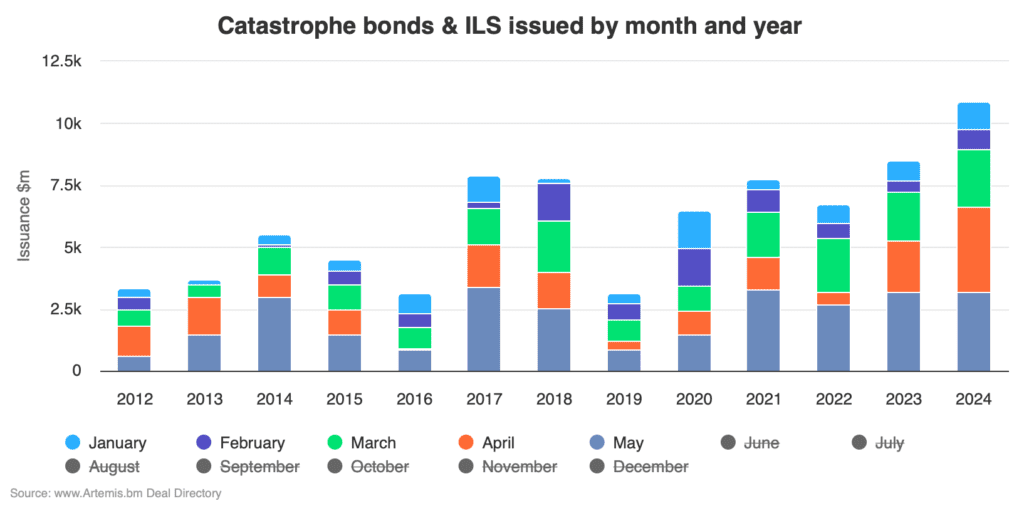
First, issuance year to-date, of which notable records set so far include the fact we’re now ahead of any other first-half and also the fact that the cat bond issuance figure for the first five months of the year is now over $2.3 billion ahead of last year and eclipses any other year in Artemis’ data set.
The chart below (and accessible here in interactive form) shows just January through May catastrophe bond issuance and you can see that 2024 is outpacing all other years significantly. You can use this chart to analyse issuance by month and year, by deselecting months you want to include data for.
Next, we can take a look at the types of deals making up the record $10.9 billion of new cat bonds and related ILS that have settled in 2024 as of today.
It’s made up of $10.34 billion of 144A property catastrophe bonds, which notable is already the fourth highest issuance for any full-year of that core component of the cat bond market.
On top of this, Artemis has so far this year tracked $360 million of 144A cat bonds covering other lines of business (cyber and health risks), as well as almost $173 million of private cat bonds (cat bond lites).
Analyse this data using the chart below (accessible here in interactive form).

Moving on to the amount of risk capital outstanding in the catastrophe bond market at this time, the total has grown 8% this year already to reach $48.7 billion and will surpass $49 billion later this week.
You can see the growth in cat bond risk capital outstanding and cat bond market size over time using the chart below (interactive version accessible here).
We all know that pricing is a key consideration and concern for some, after the rapid spread tightening that had been seen in catastrophe bonds earlier this year.
More recent spread widening and higher prices seen in new cat bond issues does seem to be balancing things out somewhat, although whether that is sustained longer-term remains to be seen.
However, our interactive chart showing the average expected loss, spread and margin above expected loss, shows that things are relatively stable, although the level of risk being assumed, in EL terms, is up slightly, especially in recent quarters (view the same data by quarter here).
The higher expected loss being seen across issues, while the average spread is actually a little higher over the years cat bonds so far compared with 2023, means that the multiple-at-market of catastrophe bonds issued has dropped, but the average for 2024 so far remains for a spread multiple of more than 4 times the expected loss (as seen in this interactive chart, which again you can also analyse by quarter here).
Finally, as 2024 catastrophe bond issuance races ahead of all records, it’s also notable that, in this chart, we show that cat bond issuance in 2024 is already the sixth highest annual total ever, and we’re still in month five of the year.
The way the market is going it will eclipse first-half records, with already more than $11.8 billion of cat bonds anticipated once everything we have in our Deal Directory has settled and potentially some more to add to that as well.
The higher the first-half record, the more likely a full-year cat bond issuance record is also set and the magic $20 billion figure is without doubt in reach of the market in 2024.
The Artemis Deal Directory lists all catastrophe bond and related transactions completed since the market was formed in the late 1990’s. The directory also lists the cat bonds waiting to settle, which are highlighted in green at the top of the list.
Analyse the catastrophe bond market using our charts and visualisations, which are kept up-to-date as every new transaction settles.
Download our free quarterly catastrophe bond market reports.
We track catastrophe bond and related ILS issuance data, the most prolific sponsors in the market, most active structuring and bookrunning banks and brokers, which risk modellers feature in cat bonds most frequently, plus much more.
Find all of our charts and data here, or via the Artemis Dashboard which provides a handy one-page view of cat bond market metrics.
All of these charts and visualisations are updated as soon as a new cat bond issuance is completed, or as older issuances mature.