The risk of buying into hype

In early June, the S&P 500 rose by more than 20% from its October low, reaching its highest level since April of last year. Often observed as a barometer for the overall health of the U.S. economy, the index’s strong performance generated some optimism with respect to the trajectory of the U.S. economy. However, when considering the market breadth, which refers to the number of stocks that are moving the index, a less optimistic picture emerges.
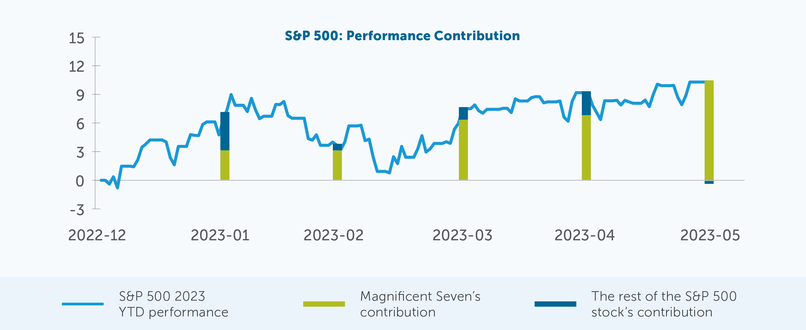
As of May 31 on a year-to-date basis, several tech stocks dubbed the “Magnificent Seven” have accounted for over 100% of the gains in the S&P 500 Index, while the remaining stocks within the index experienced negative returns over the same period.

Source: Bloomberg as of May 31, 2023
The “Magnificent Seven” moniker refers to Apple, Microsoft, Nvidia, Amazon, Meta (Facebook), Tesla and Alphabet (Google). Several of these stocks have surged in popularity due to a growing interest in Artificial Intelligence (AI), while others have enjoyed a halo effect due to this trend. Combined, they make up over 27% of the Index as illustrated in the table below.
Stock
YTD Return (%)
YTD Avg. Wgt. in S&P 500 (%)
Wgt. In S&P 500
as of May 31, 2023 (%)
Apple Inc.
36.82
6.84
7.54
Microsoft Corp.
37.57
6.00
6.99
Amazon.com Inc.
43.55
2.64
3.08
Nvidia Corp.
158.93
1.78
2.66
Alphabet Inc.
39.15
3.37
3.93
Meta Platforms Inc.
119.98
1.27
1.69
Tesla Inc.
65.55
1.38
1.57
Total
23.28
27.45
Source: Bloomberg as of May 31, 2023.
Digging deeper: The observed effects of market concentration
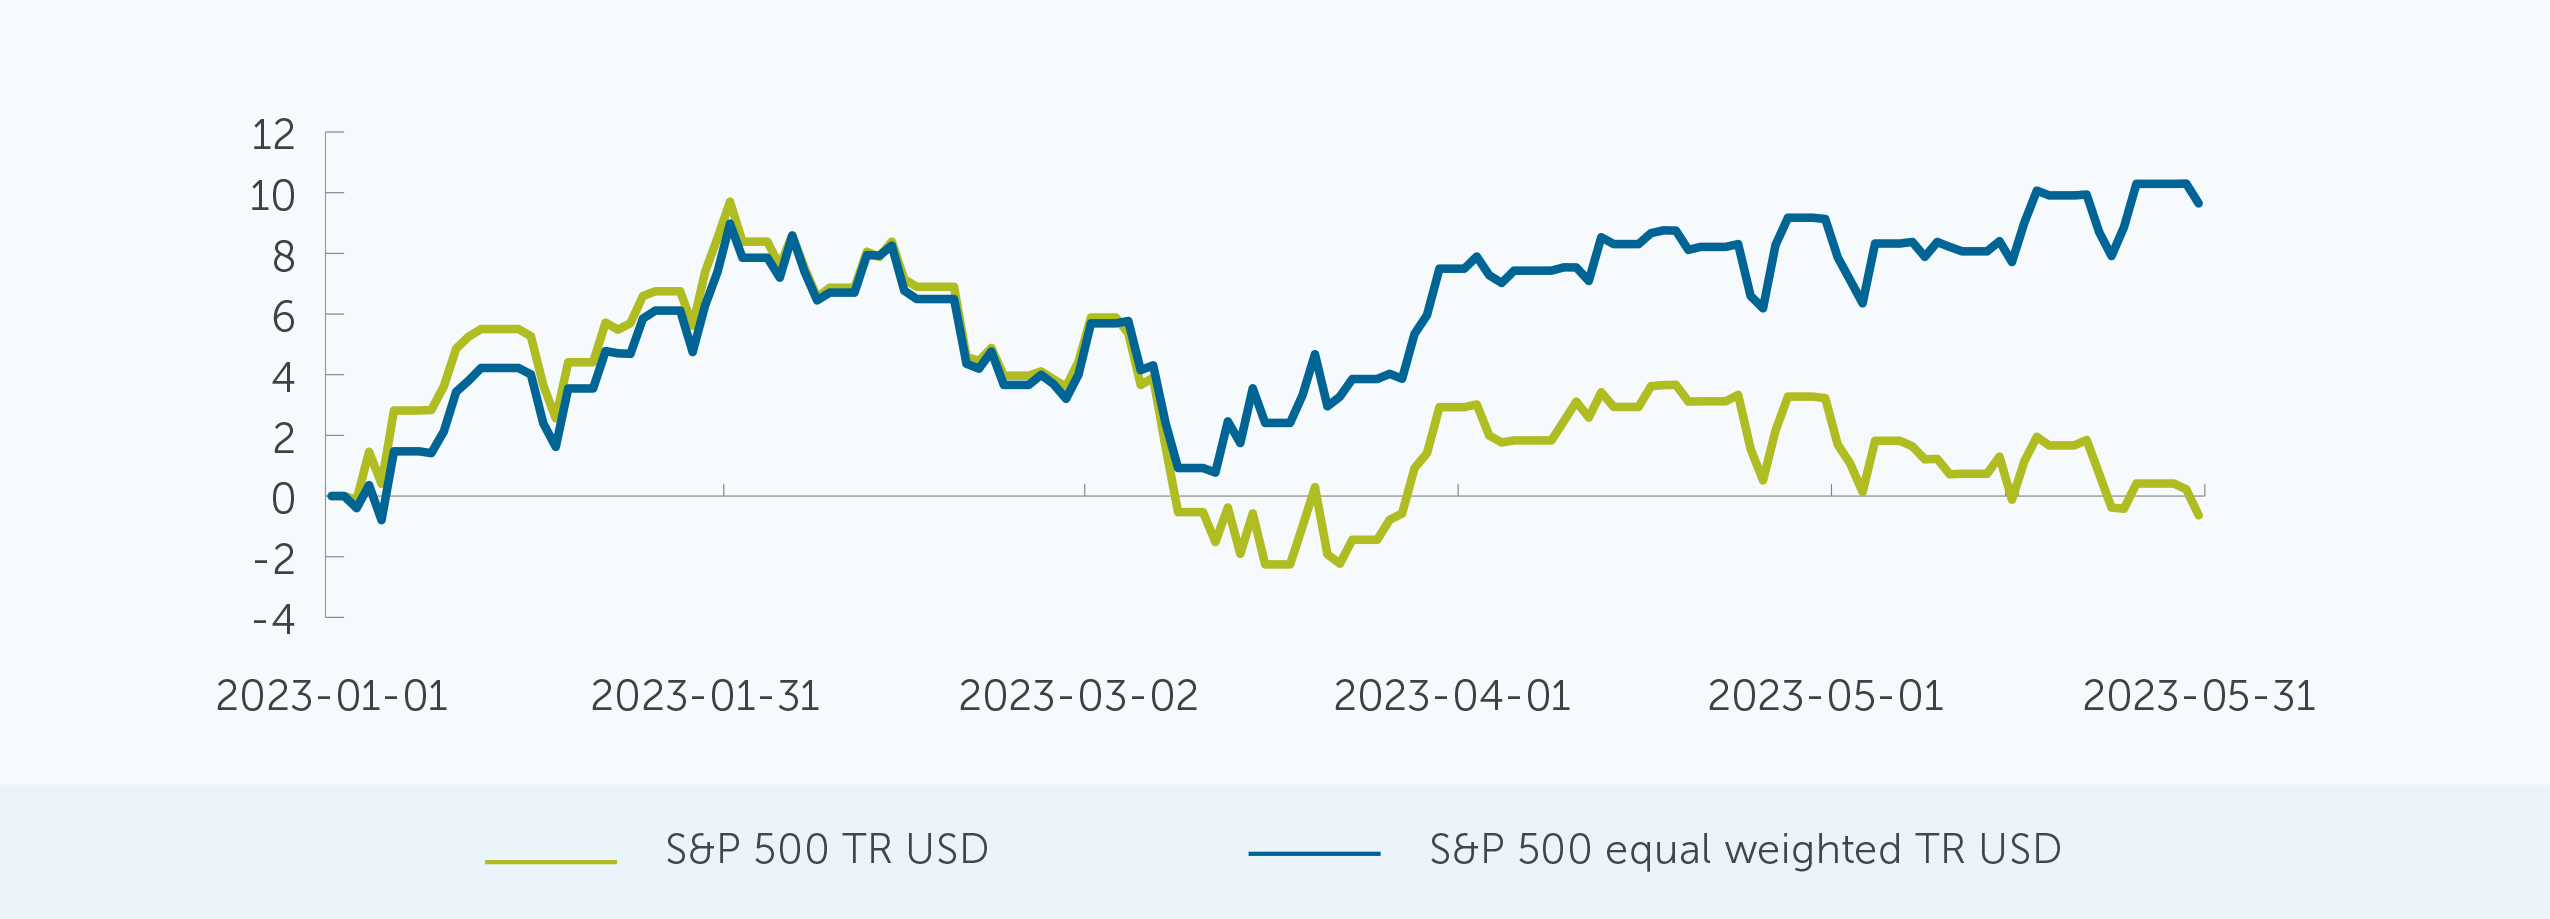
A more sobering picture emerges when a comparison is made between the returns of the S&P 500 Index, which weights individual stocks in the index based on their market capitalization (or size), and the S&P 500 Equal Weight Index, which gives each security in the index an equal weight.
During normalized market conditions, the returns of the two indices tend to track each other closely. However, in periods of high market concentration, they tend to diverge, as shown in the chart below.

Source: Morningstar Research Inc., as of May 31, 2023
This divergence is observed because companies with larger market caps will constitute a greater proportion of the S&P 500 Index. When these large companies demonstrate strong performance, the index will rise correspondingly. However, when each underlying company in the index is equally weighted, the effects of the companies’ size will not
skew the index’s performance.
Market conditions have been advantageous for the magnificent seven
The two indices performed similarly until early to mid-March when cracks in the U.S. regional banking sector began to emerge, leading to the collapse of Silicon Valley Bank, Signature Bank and First Republic Bank within the first two weeks of the month.
In the immediate aftermath of the bank failures, the U.S. Federal Reserve, through various guarantees and access to funding, effectively increased the liquidity in the banking system. Many investors also believed that the turbulence caused by the bank failures would act as a catalyst for the central bank to begin cutting rates. These two factors
created an exceptionally favourable environment for mega cap tech stocks that were fuelled by the enthusiasm surrounding artificial intelligence (AI).
In many ways, the surging interest in AI resembles the dot-com bubble of the late 1990s where the growth in internet adoption fuelled a growing interest in tech stocks. Much like the businesses associated with the growing popularity of the internet back in late 1990s, stocks even tangentially related to AI have experienced a surge. In both cases, stock prices were largely driven by market sentiment that often had limited correlation with the fundamental earnings potential of the companies involved.
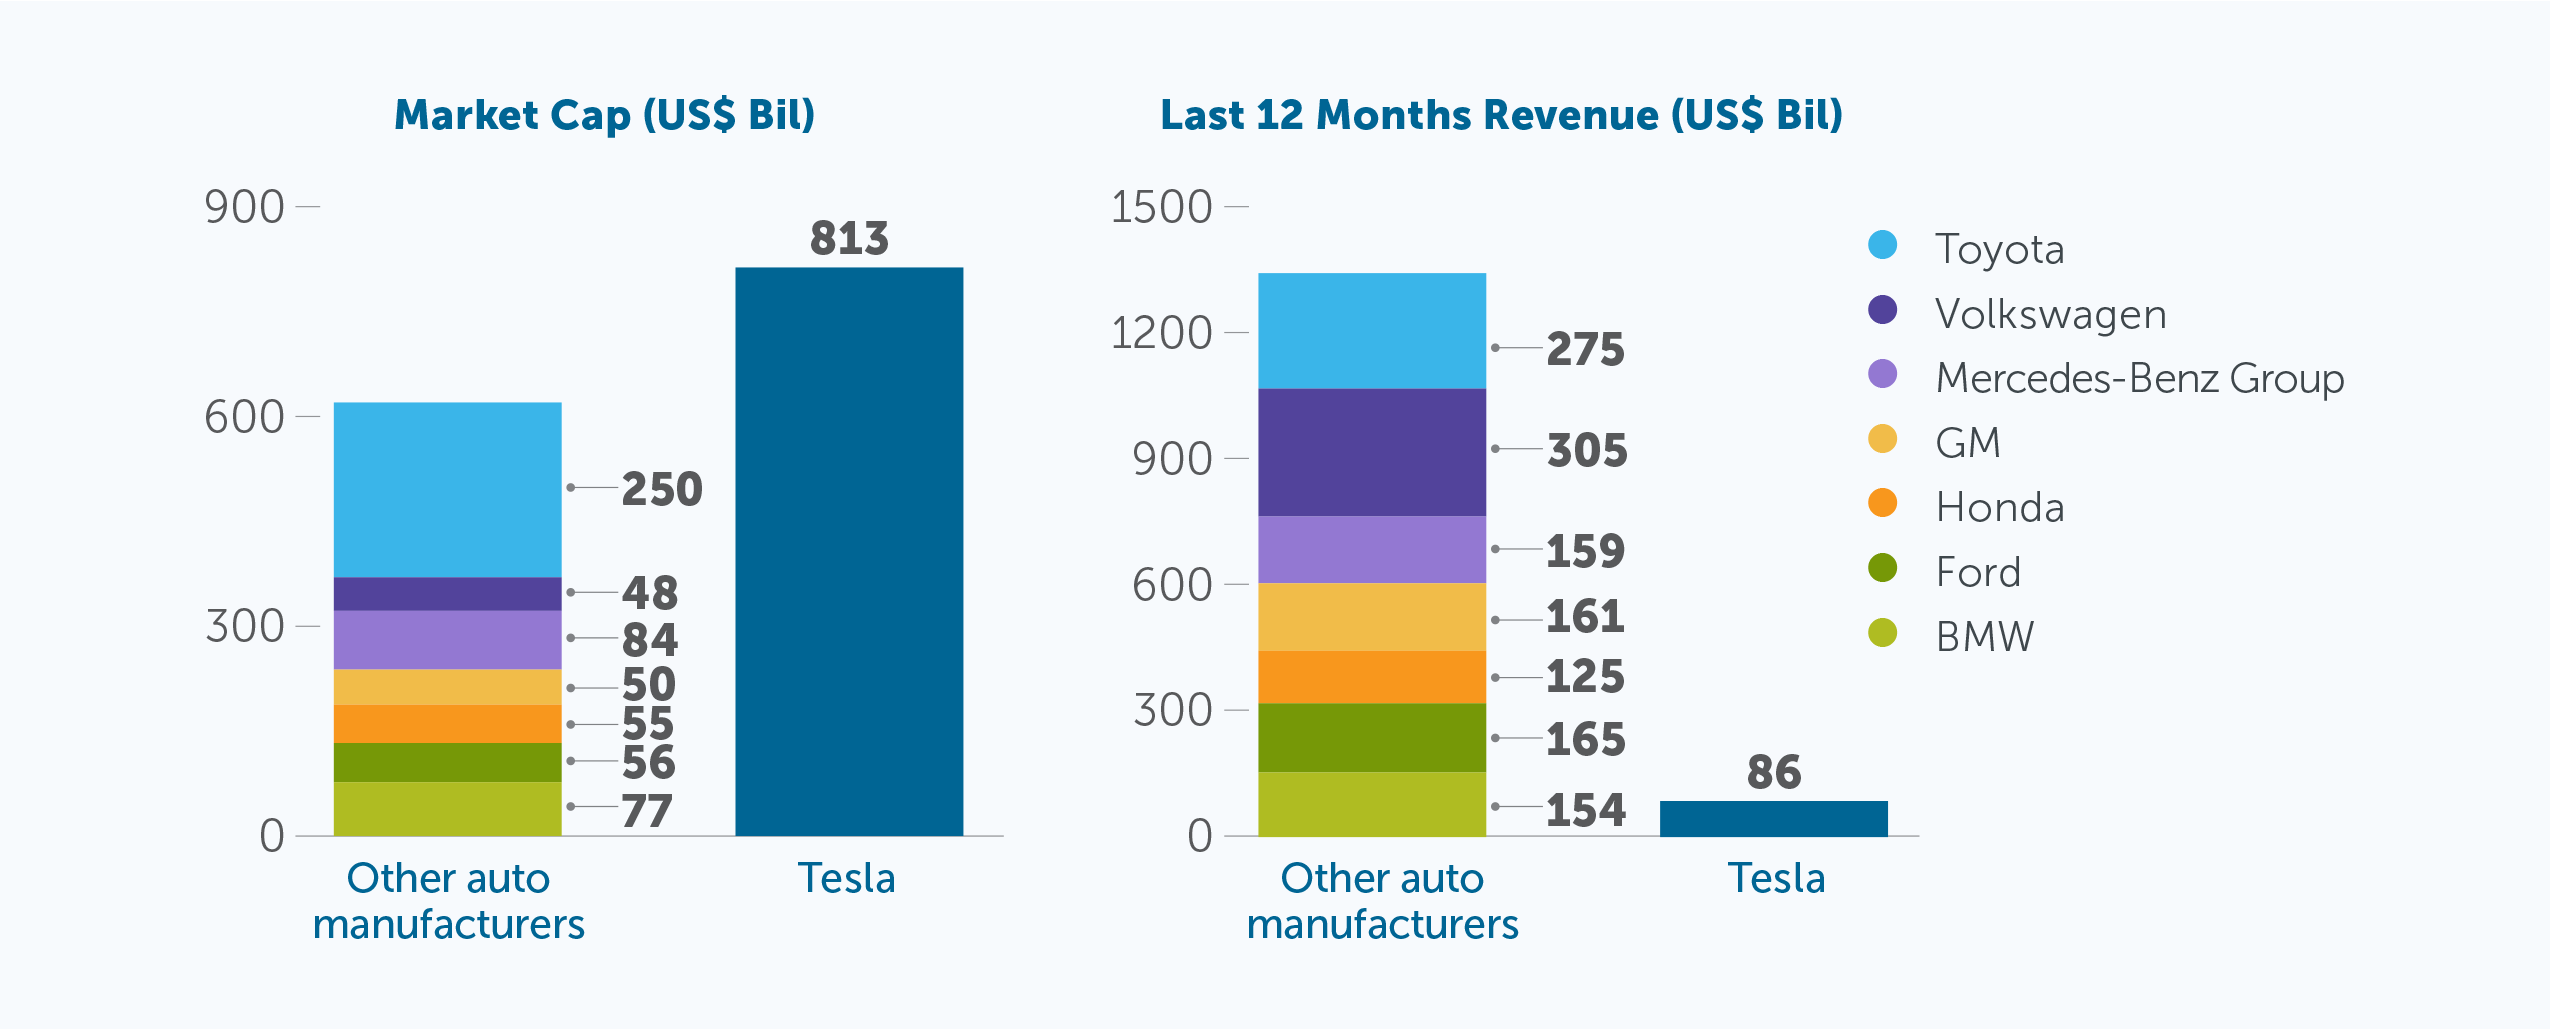
For example, when we take a closer look at Tesla, one of the stocks among the “Magnificent Seven” cohort, we see that the stock’s performance has little to do with fundamentals when compared to the broader car manufacturing industry.
As shown in the table below, Tesla is worth 31% more than the 7 biggest automakers combined, but only generates 6% of their combined revenue.

Source: Bloomberg. Market Cap Data is reported as of June 23, 2023. Revenue data is based on the most recent data available as of March 31, 2023.
Market concentration was already on the rise throughout 2018 and 2019, but increased rapidly after central banks and governments around the world turned on the liquidity taps to help reduce some of the instability caused by the COVID-19 pandemic measures. The chart below shows that the weight of the top five stocks have reached historical highs. For every dollar invested in stocks in the S&P 500, almost $0.25 flowed directly into the top five stocks.

Source: Bloomberg as of May 31, 2023.
This level of concentration within the broader index has changed the market dynamics with implications for investors. Strategies that are designed to be well-diversified are likely to trail the broader index. In the Empire Life American Value GIF, we hold some of these “Magnificent Seven” securities. However, given our views on diversification and valuation, we are below the market weight in these securities, and will therefore almost certainly under perform the index in an environment where returns are driven by a small group of stocks.
An argument for diversification
In the case of the dot-com bubble, investors were ultimately correct in terms of the success some of these companies would achieve–they were just 10-15 years too early. Many of the companies that benefited from the favorable conditions towards tech stocks went on to achieve further success, however, not before experiencing massive declines in their stock prices when the bubble ultimately burst. It is conceivable that the AI hype will play out in a similar fashion as narrow rallies tend to lead to an increased risk of abrupt and turbulent shifts as the trend reverses course.
As the average valuation levels move higher, concentrated portfolios will also become increasingly vulnerable to sharp drawdowns compared to a more broadly diversified portfolio.
Rather than chasing returns, the Empire Life investment team considers diversification across sectors, asset classes, and regions to be a critical aspect of the investment process in order to support the long-term success of our clients. Our strategies mitigate the risks associated with concentrated holdings and provide exposure to a broader range of
long-term opportunities.
This article includes forward-looking information that is based on the opinions and views of Empire Life Investments Inc. as of the date stated and is subject to change without notice. This information should not be considered a recommendation to buy or sell nor should it be relied upon as investment, tax or legal advice. Information contained in this report has been obtained from third party sources believed to be reliable, but accuracy cannot be guaranteed. Empire Life Investments Inc. and its affiliates do not warrant or make any representations regarding the use or the results of the information contained herein in terms of its correctness, accuracy, timeliness, reliability, or otherwise, and do not accept any responsibility for any loss or damage that results from its use.
Past performance is no guarantee of future performance. Empire Life Investments Inc., a wholly owned subsidiary of The Empire Life Insurance Company, is the Portfolio Manager of Empire Life Segregated Funds. The units of the Funds are available only in those jurisdictions where they may be lawfully offered for sale and therein only by persons permitted to sell such units. Commissions, trailing commissions, management fees and expenses all may be associated with segregated fund investments. Investments are not guaranteed, their values change frequently, and past performance may not be repeated. Any amount that is allocated to a Segregated Fund is invested at the risk of the contract owner and may increase or decrease in value. A description of the key features of the individual variable insurance contract is contained in the Information Folder for the product being considered. Segregated Fund policies are issued by The Empire Life Insurance Company.
© 2023 Morningstar Research Inc. All rights reserved. The information contained herein: (1) is proprietary to Morningstar and/or its content providers; (2) may not be copied or distributed; and (3) is not warranted to be accurate, complete, or timely. Neither Morningstar nor its content providers are responsible for any damages or losses arising from any use of this information. Past performance is no guarantee of future results.
June 26, 2023


