Stocks Get Hit as 'AI Trade' Slams Into a Wall

But as far as quarterly results, the concern is not exclusively related to tech. Broadly, second-quarter earnings season is off to a weaker start than usual.
Among S&P 500 companies that reported results, profits beat analyst estimates by the smallest margin since the end of 2022 — while sales surprises were the worst in at least two years, data compiled by Bloomberg show.
“We are still looking for volatility to increase moving through the second half of 2024 – with the potential for a 10% to 15% correction in benchmarks like the S&P 500 and the Nasdaq 100,” said Dan Wantrobski at Janney Montgomery Scott.
“Our work does not point to secular/structural downturn at this time, but rather a pause in the reflationary expansion cycle that began a few years ago,” he added.
To Jose Torres at Interactive Brokers, the equity correction is far from over.
Despite recent selling, the S&P 500 is still trading close to 22 times earnings amidst quarterly results that aren’t impressing investors in aggregate. In addition, the benchmark is still up about 15% year to date, which is terrific considering it isn’t even August.
“Yesterday we wrote that a 10% to 15% correction was in the cards this quarter, historically the worst period of the year,” Torres said. “This quarter, the valuation concerns are paired with front-loaded gains, irrational exuberance, a high bar for earnings estimates and a presidential election.”
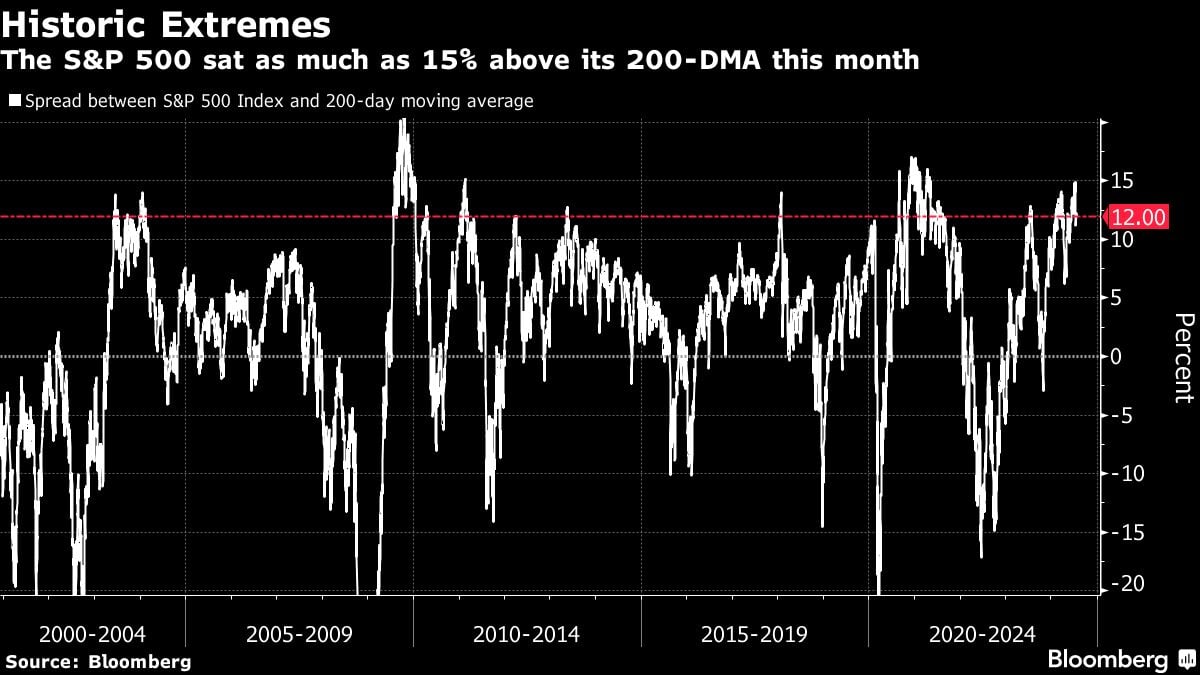
Just as earnings roll in, a key technical indicator in the U.S. stock market sat close to historic extremes — a crucial gauge that has foretold past selloffs.
Known as the “the 200-DMA” — an abbreviation of 200-day moving average — the gauge measures how the S&P 500 is performing against that longer-term measure. At one point last week, the benchmark was trading as much as 15% above it, according to data compiled by Bloomberg.
Although that does not necessarily mean the market is about to tank, it is a warning sign for investors concerned about lofty tech valuations and concentration risk.
The recent slump in U.S. stocks is flashing a warning to trend-following funds: sell US equities no matter which direction the market goes.
Both the Nasdaq 100 and the S&P 500 benchmarks have breached thresholds that trigger a selling signal for commodity trading advisers, or CTAs, according to models at Goldman Sachs Group Inc.’s trading desk.
If stocks keep falling, those rules-based traders could unwind $32.9 billion of global stocks with $7.9 billion flowing out of the US market, according to an analysis from the bank’s trading desk. Even if the market reverses its slide, CTAs are still poised to sell $902 million of U.S. stocks.
Stock Markets
The S&P 500 fell 2% as of 2:44 p.m. New York time.
The Nasdaq 100 fell 3.3%.
The Dow Jones Industrial Average fell 1%.
The MSCI World Index fell 1.6%.
(Credit: Adobe Stock)


