Canadian Dividends done right: Quality and growth yields greater returns

Investing in Canadian dividend equities has proven to be a successful strategy over the long run for our segregated fund portfolio managers. In addition to demonstrating favourable downside protection1 and diversification benefits, Canadian dividend equities have outperformed the broader Canadian equity market over the long term.
![]() Download the PDF
Download the PDF
Despite this long-term outperformance, several Canadian Dividend sectors have had a hard time keeping up with the broader benchmarks for much of the past three years. A key factor contributing to this underperformance has been rising interest rates, which make dividend yields less competitive with other income-oriented investment vehicles that have proliferated the Canadian market over the past several years.
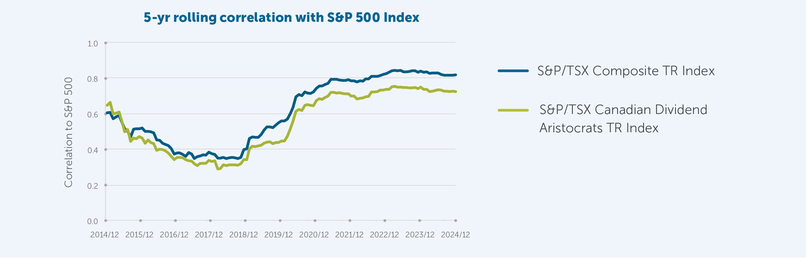
Source: Bloomberg, 2024. Historically, Canadian dividend equities have provided superior diversification benefits against US equities compared to the broader Canadian equity markets.
However, the Bank of Canada’s overnight rate has started to decline from a peak of 5.0% in June of 2024 to 3.00% in January 2025. Therefore, we believe that much of what has ailed Canadian dividend equities since the summer of 2022 has inflected positively, and we could be at the early stages of a material shift of capital away from risk-free investments and other variable rate yield products (GICs, high interest savings ETFs) back into defensive dividend-paying equities. CIBC estimates that there is nearly $220 billion (equating to ~15% of Canadian equity yield market capitalizations, including financials, telecommunications, utilities and real estate) parked in low risk or risk free investments that could flow into defensive dividend equities, providing that policy interest rates continue to moderate.2 Sure enough, Canadian dividend equities have already started to outperform3 since policy rates started to decline roughly six months ago and could continue to outperform if capital begins to flow out of high interest accounts, which typically occurs with a predictable lag to falling interest rates.

Source: Bloomberg 2024. Relative performance of high dividend-yielding sectors against broader S&P/TSX Composite Index between Feb 25, 2022, when The Bank of Canada first raised the overnight lending rate and the first rate cut on June 4, 2024.
Not all dividend strategies are created equally
At present, yields on defensive dividend stocks are at attractive levels on an absolute basis and are becoming more compelling relative to risk free rates as they decline. This is especially true in certain sectors, such as Telecommunications and Energy Infrastructure.
Although focusing on dividend yield alone has proven to be an outperforming strategy, the most successful dividend strategies focus less on absolute yield and instead on high-quality companies that are able to consistently increase dividends over time. This approach has shown to add meaningful incremental performance with less volatility and downside risk.

Source: Bloomberg as of December 31, 2024. Risk free rate is represented by the yield of a Generic Canadian 5-year Government Bond Index. Pipelines Sector is represented by the S&P/TSX Composite Oil & Gas Storage & Trans Sub Industry Index, Communication Services Sector is represented by the S&P/TSX Communication Services Sector Index. Indices are unmanaged and cannot be invested in directly.
So why do dividend growers typically outperform over the long run? Generally speaking, they are higher quality companies. As such, they typically exhibit more defensive characteristics, such as strong balance sheets and conservative payout ratios, allowing them to raise dividends above and beyond earnings growth. More importantly, they are able to generate returns above their cost of capital, giving them the ability to grow earnings and free cash flow per share over time and often provide better opportunities for capital appreciation, which is more tax efficient than dividend income. As equity investors, while we appreciate the power of dividends, our portfolio managers are ultimately interested in compounding total returns (dividends + share price appreciation), not just harvesting yield.

Source: Morningstar & Empire Life Investments 2024. Index returns are presented as Net Total Returns with dividends reinvested. Feb 27, 2009 marks the Financial Crisis market low.
In summary
Despite the recent outperformance of dividend-paying Canadian equities, we continue to find opportunities guided by our bottom-up security selection process. Moreover, a further moderation of interest rates would likely continue to benefit dividend-paying stocks in Canada. Irrespective of the interest rate environment, the team will continue to focus on high quality dividend growers and selective value opportunities, a strategy that we expect to “pay dividends” over the long term.
1 From December 2009 to December 2024 the average three year rolling downside capture ratio for the S&P/TSX Dividend Aristocratic Index versus the S&P/TSX Composite Index was 85.68%.
2 Source: CIBC Capital Markets, The Rotation Into High Yielding Canadian Equities Is Just Beginning – August 18, 2024.
3 As of December 31, 2024 the S&P/TSX Dividend Aristocrats Index was +31.5% since May 31, 2024 outperforming the S&P/TSX Composite Index which returned 23.3% over the same time period.
This document includes forward-looking information that is based on the opinions and views of Empire Life Investments Inc. as of the date stated and is subject to change without notice. This information should not be considered a recommendation to buy or sell nor should they be relied upon as investment, tax or legal advice. Information contained in this report has been obtained from third party sources believed to be reliable, but accuracy cannot be guaranteed. Empire Life Investments Inc. and its affiliates do not warrant or make any representations regarding the use, or the results of the information contained herein in terms of its correctness, accuracy, timeliness, reliability, or otherwise, and do not accept any responsibility for any loss or damage that results from its use.
Past performance is no guarantee of future performance.
Empire Life Investments Inc., a wholly owned subsidiary of The Empire Life Insurance Company, is the Portfolio Manager of certain Empire Life Segregated Funds.
Any amount that is allocated to a Segregated Fund is invested at the risk of the contract owner and may increase or decrease in value. A description of the key features of the individual variable insurance contract is contained in the Information Folder for the product being considered. Segregated Fund policies are issued by The Empire Life Insurance Company.
© 2025 Morningstar Research Inc. All rights reserved. The information contained herein: (1) is proprietary to Morningstar and/or its content providers; (2) may not be copied or distributed; and (3) is not warranted to be accurate, complete, or timely. Neither Morningstar nor its content providers are responsible for any damages or losses arising from any use of this information.
® Registered trademark of The Empire Life Insurance Company. Policies are issued by The Empire Life Insurance Company
February 2025


