The 5 auto sales terms you should know to read car sales reports like a pro

Enjoy following along with our 2023 and 2024 sales stories but not familiar with the lingo? Don’t feel bad. Like any business, the auto industry loves its jargon, but once you understand a few key terms, you’ll be able to ignore the press release entirely and analyze the numbers for yourself. Ready to dig deeper than whatever “segment-best!” claims you’ve read in today’s headlines and get into the nitty-gritty of sales data? Well, you’ve come to the right place. There are just a few terms you need to understand in order to read a sales chart like a pro. Let’s dive in.
SAAR
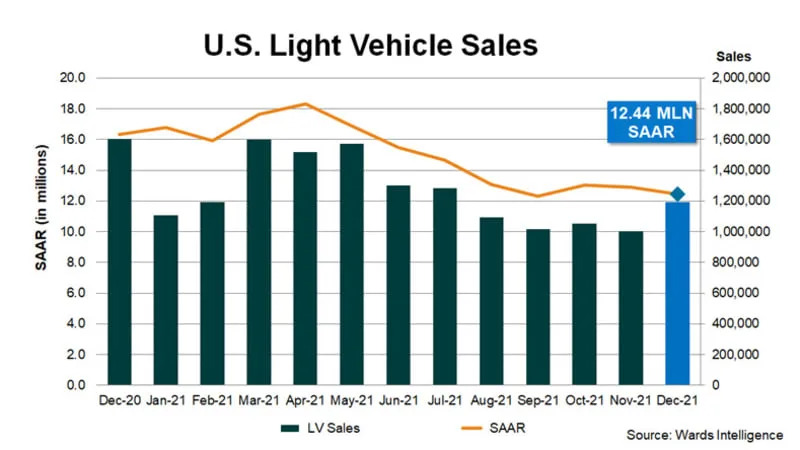
We’ll start here, because it’s the least intuitive and most abstract. Many sales stories lead with a SAAR number. It stands for “Seasonally Adjusted Annualized Rate” and it’s simply an estimate of how many cars will be sold in any given year extrapolated from (stat speak for “based on”) the data available so far. To obtain this number, data magicians look back at decades of sales figures and say, “OK, given the current economic climate and the sales volumes we’ve seen thus far, here’s what we can expect the market to look like by year end.”

And because it’s based on cumulative sales data, SAAR gets more accurate as the year goes on and more figures become available. The above are full-year sales charts from Wards. The left side is 2020; the right is 2021. These charts depict actual sales (dark bars) vs. the SAAR (orange line) as both react to the pandemic. You can see the SAAR adjust sharply to the initial shutdown early in 2020, but fail to pick up on the onset of the supply chain crisis later in the year. Why? Sales normally decline in the winter, so there wasn’t much cause for alarm. Sales even ticked up in Q2, and customer interest helped drive SAAR up despite the fact that constraints were already strangling inventories. By May, the SAAR had adjusted to the “new normal.”
So when you see “SAAR,” you know it means the bean counters are projecting a certain number of year-end auto sales based on current trends. That’s it!
Delivery
For the purposes of reporting, a delivery is a sale. More accurately, it’s the final sale to a customer. Whether that’s Tim the Electrician taking his truck home or TimCo the Electrical Contractor receiving a new fleet of 60, they’re all deliveries. This is where sales are recorded for the automakers. In some countries, sales are tracked by registrations instead.
YTD/QTD/MTD
Year to Date/Quarter to Date/Month to Date. These are fairly commonplace financial terms that are used conventionally in automotive reporting. No need to overthink these; they mean exactly what they say — they describe the period in question so far.
YoY/MoM/QoQ
Year over Year/Month over Month/Quarter over Quarter. When figures are described as year-over-year or month-over-month, that means they’re being directly compared to the month prior. However, we’ve seen this language used inconsistently in automotive reporting, so take it with a grain of salt. Virtually every automaker reports sales relative to the same period of the previous year (e.g., January 2024 vs. January 2023). Only rarely do automakers refer to the preceding month’s sales as a point of comparison, and when they do, it’s usually in the notes, not the sales charts.
DSR/Selling Days
The Daily Selling Rate and Selling Days are adjustments made to raw sales data to help provide context. While sales figures are inherently objective, sometimes comparing the same month from two different years isn’t as accurate as it may seem. Due to quirks of the calendar and the arrangements of U.S. weekends and holidays, dealers may not have had their doors open the same number of days when you compare the same month across different years. So if there were 26 selling days in July of 2022 but 28 of them in July of 2023 (figures made up), all other things being equal, July, 2023 should have been a better month for sales. This information is often grouped together with other outliers, such as big sales holidays falling on long weekends that bleed between months, which can wreak havoc on accounting.
Go forth and analyze!
Now you’ve got the tools to read an automotive sales report like a pro. If there’s anything we missed, feel free to let us know in the comments.


