The Elasticity of Pharmaceutical Innovation
That is the title of a new USC white paper by Darren Filson, Karen Van Nuys, Darius Lakdawalla and Dana Goldman with the subtitle “How Much Does Revenue Drive New Drug Development?”
What is the elasticity of innovation?
It measures the percentage change in innovation—using the flow of new drugs approvals, or Phase 1, 2, or 3 starts— caused by a percentage change in revenues, typically expected
future revenues.
In practice, it is change in profits that matters, but future revenues are much more observable and predictable than future profits. Thus, the authors focus on the elasticity of innovation with respect to revenue rather than profits.
How much do future revenues impact the likelihood of new drug development?
All the studies conclude that the elasticity is positive—i.e., lower revenues lead to less R&D— but estimates vary widely. However, we argue that a typical long-run elasticity associated with U.S. revenues lies within the range of 0.25 to 1.5, implying that for every 10% reduction in expected revenues, we can expect 2.5% to 15% less pharmaceutical innovation.
What is driving the variability in these estimates?
One key question is why there is such a big range in these estimates? Certainly different study designs matter (see below). The authors also claim that factors such as “the time horizon studied, the size of the price change, cost of drug development, barriers to value-based pricing, and other marketplace factors” all impact the magnitude of the elasticity of innovation.
What methodologies are used in the literature to estimate the elasticity of innovation?
Cross sectional: exploit variation in revenues across therapeutic classes (or some other unit of analysis) to estimate the elasticity. For instance, they may compare “high-revenue” vs. “low-revenue” classes to infer the elasticity [Examples: Lichtenberg (2005) and Civan and Maloney (2009)].Aggregate time series: exploit variation in industry-level revenues over time [Example: Giaccotto, Santerre and Vernon (2005)]Panel data approaches: include drug-class “fixed effects” and net out hard-to-measure and persistent differences in class characteristics. In essence, this approach approach focuses on within-class revenue change as a driver of within-class innovation changes. These analyses typically require the use of “natural experiments” that cause a differential change in revenue across different segments of the market. Examples of natural experiments include future demographic changes or the advent of Medicare Part D. [Examples: Acemoglu and Linn (2004); Dubois et al. (2015); Blume-Kohout and Sood (2013)]Parameterized computational models (aka structural models): specify firms’ objective functions, strategy sets and features of the business environment, and when the model includes multiple firms, the model typically requires that the market is in equilibrium. Parameters are selected to match those in the real world (e.g., average R&D expenses) and calibrated such that the model outputs also match real-world outcomes (e.g., average flow of new drugs). [Examples: Abbott and Vernon (2007); Filson (2012); Adams (2021)]
The authors argue that panel approaches and parameterized computational models are preferred.
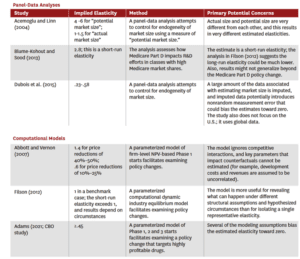
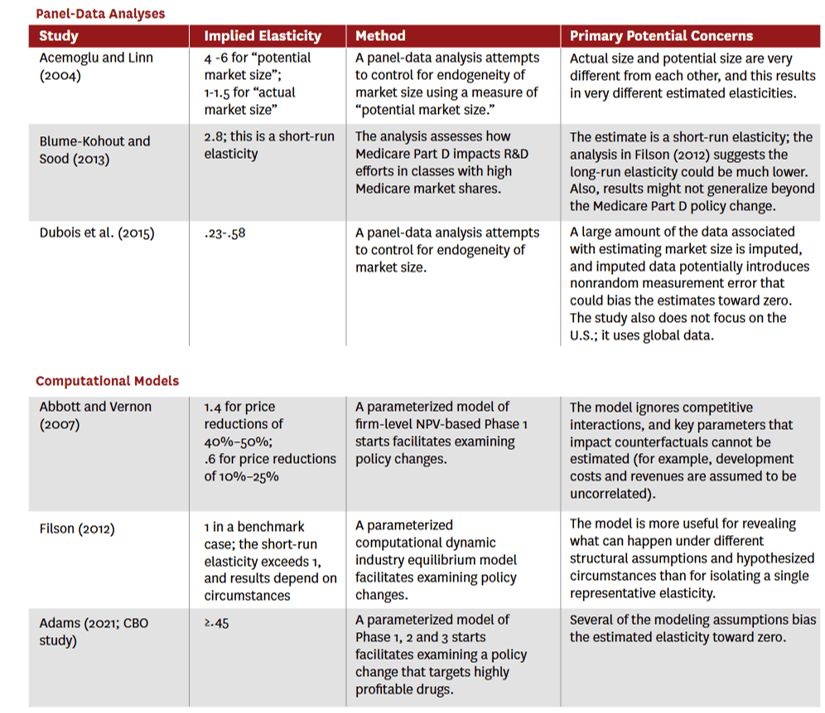
For the studies with the preferred panel or computation approach, which individual elasticity of innovation estimates did they arrive at?
The authors have a nice table summarizing the findings which I pasted below.
https://schaeffer.usc.edu/wp-content/uploads/2025/02/2025-02-pharmaceutical-innovation.pdf
Great work by my colleagues at USC! I certainly encourage you to read the full article here.