Risk aversion estimates for GRACE

Generalized risk-adjusted cost effectiveness (GRACE) aims to incorporate risk preferences into standard cost effectiveness analysis (CEA) methods. While traditional CEA assumes individuals are risk neutral, GRACE allows for risk preferences to influence value. Namely, that health gains in more severely ill health states are valued more than equivalent health gains in better health states. But a key parameter for estimating GRACE is knowing risk aversion estimates over quality of life outcomes.
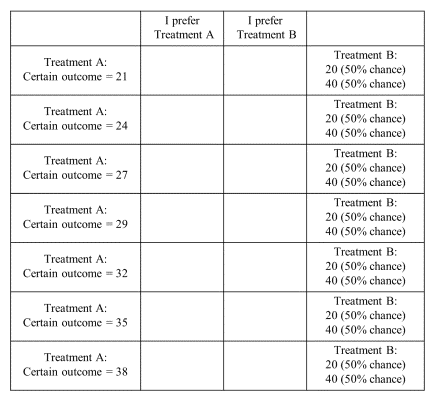
A recent NBER working paper by Mulligan et al. (2023) provides an approach for doing this. Individuals are present with a certain quality of life and a risk one. The survey asks which one individuals would prefer. This process is repeated using different certain values. Using this approach, the authors calculated certainty equivalents for each scenario as the midpoint of the certain outcomes between the two adjacent rows in which a respondent switched from preferring the risky treatment to preferring the treatment with a certain outcome.

Once the certainty equivalent is known, one can then estimate an individual’s utility function. Baseline approach used expected utility theory assuming that reference health does not matter, and the authors pooled data for all respondents and questions. Moreover, the authors estimated utility using both a expo-power and constant relative risk-aversion (CRRA) utility functions (see formulas below).


Using this approach, the authors find that:
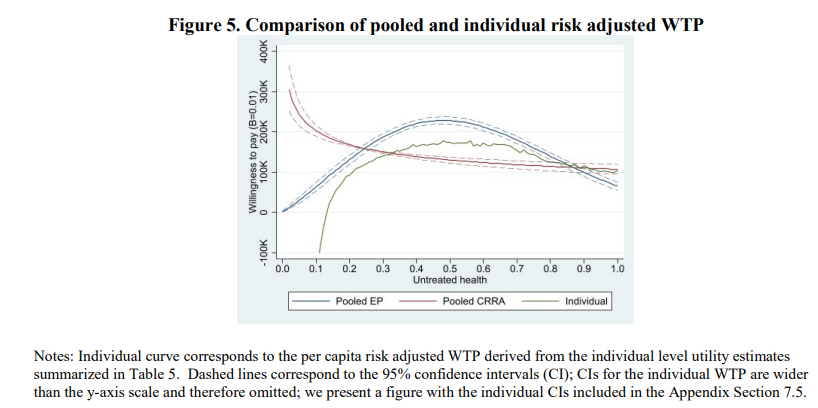
… individuals exhibit risk-seeking preferences at low levels of health, switch to risk-averse preferences at health equal to 0.485 (measured on a zero to one scale), and become most riskaverse when their health is perfect (coefficient of relative risk aversion = 4.36). The risk preference estimates imply an empirical premium for disease severity: each unit of health is worth three times more to patients with serious health conditions (health equals 0.5) than those who are perfectly healthy. They also imply that traditional CEA overvalues treatments for the mildest diseases by more than a factor of two. Use of traditional CEA both overstimulates mild disease treatment innovation and underprovides severe disease treatment innovation.

Note that these results are sensitive to specification. The expo-power function is parabolic shaped where mild and very severe diseases are over-value and fairly severe diseases are undervalued. With CRRA, however, the relationship is monotonic (more severe implies higher willingness to pay. The authors explain that this reversion of switching between being risk averse and risk loving at the lowest quality of life scores may be due to coding gambles as gains to losses (as is assumed under prospect theory).
One benefit of the approach is that authors are using 0 to 100 health states so that quality of life can be quantified. In practice, however, respondents may or may not have a good understanding of what a quality of life of 50 means. One could use actual health states, but individual may vary in terms of their valuations of these health states.
This is a pivotal and I certainly recommend your read the full article here.


