Use of real-world data for measuring treatment effectiveness for target populations

Randomized controlled trials are the gold standard for evaluating treatment efficacy, but effectiveness in the real-world may vary. One reason for this is that clinical trials often have stricter inclusion criteria than is the case for the target treated population. Policymakers, payers, and clinicians may wonder how well the results from the narrower clinical trial population translate to the real-world ‘target’ population.
This is the question a paper by Lugo-Palacios et al. (2024) aims to answer. The goal of their study is to determine which second-line treatment for type 2 diabetes is most effective in the real world. To do this, the authors estimate the average treatment effect (ATEs) and conditional average treatment effect (CATE) for the use of dipeptidyl peptidase‐4 inhibitors (DPP4i) and sulfonylureas (SU) as ‘add on’ therapies to metformin for the treatment of patients with type 2 diabetes in England. The primary endpoint of interest was glycemic control. One challenge is, that published RCTs report do not have a consensus recommendation; some find superior improvement with SUs and others with DPP4i. As mentioned above, one problem is that RCTs evaluating these treatments is that they often exclude patients with very poor glycemic control and thus the extent to which different types of real-world patients would benefit from each treatment is unclear.
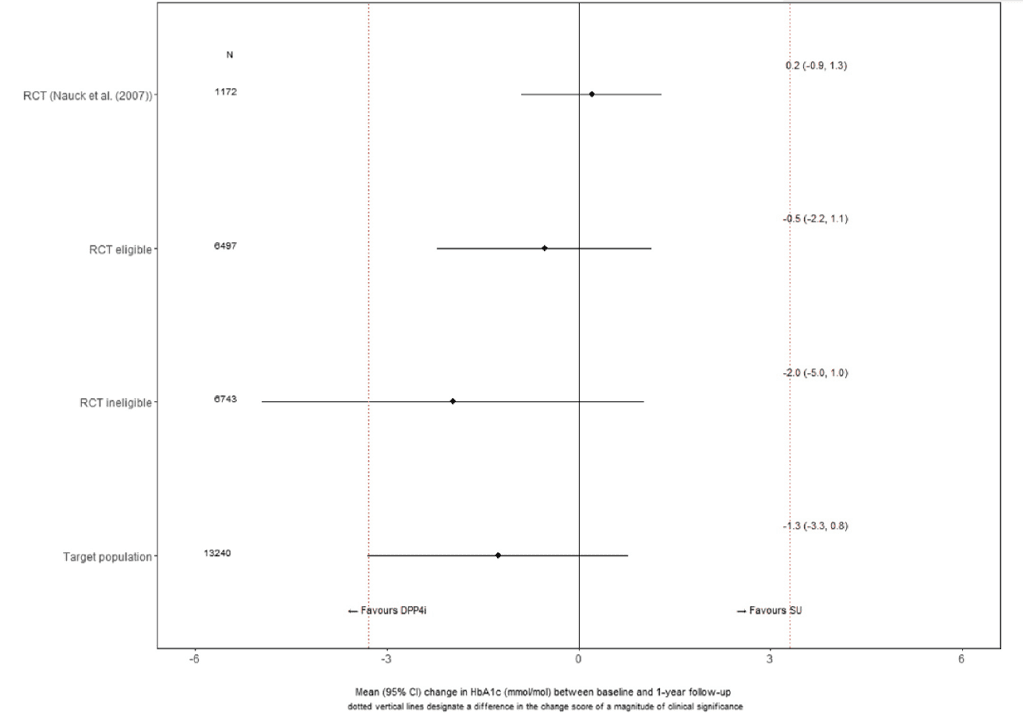
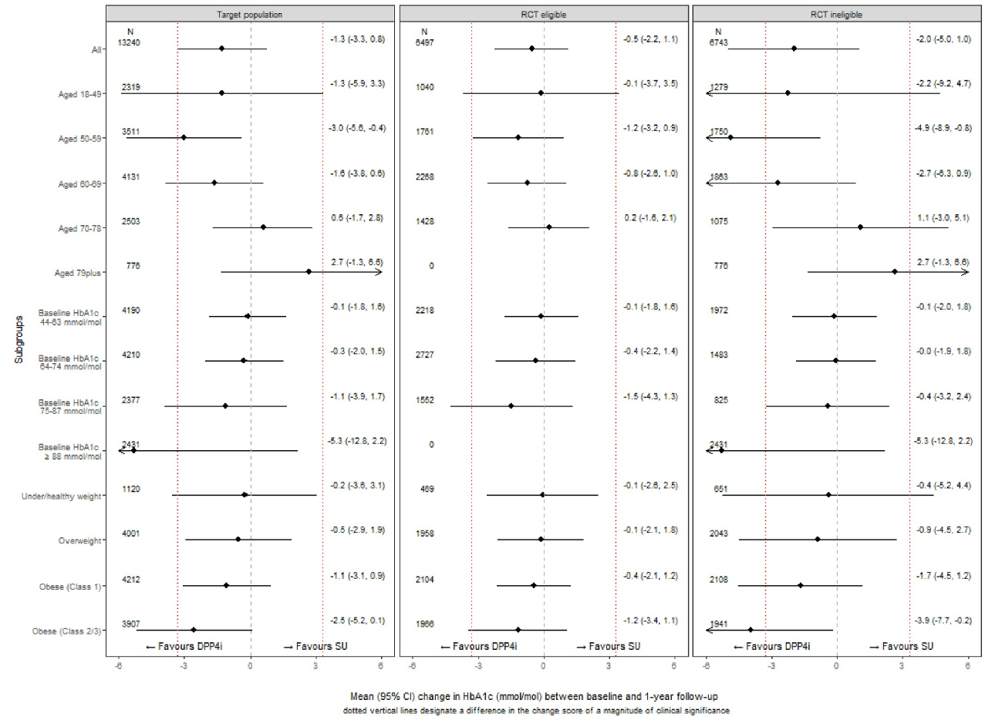
The study approach identified subpopulations from within the target population into two groups: those who met a published RCT’s eligibility criteria (‘RCT eligible’) and those who did not (‘RCT ineligible’). The authors compare the ATE for the ‘RCT eligible’ to the RCT with the same eligibility criteria (the ‘RCT benchmark’) to examine how well real-world data imitates RCT data. Next, the authors compared CATEs for the overall target population(i.e., ‘RCT eligible’ and ‘RCT ineligible’ groups). CATEs were estimated separately by age, ethnicity, baseline HbA1c, and body mass index (BMI). Covariates used in the analysis included demographics and clinical factors (i.e., baseline HbA1c, systolic blood pressure (SBP), diastolic blood pressure (DBP), estimated glomerular filtration rate (eGFR), and BMI)
The econometric approach was to use local instrumental variables (LIV). The instrument used was
…clinical commissioning groups (CCG)’s tendency to prescribe (TTP) DPP4i as second‐line treatment. Over the study time‐frame, general practitioners (GPs) worked within a CCG which informed health funding decisions for its respective geographic region. For example, some CCGs tended to recommend –to their affiliated GPs– the prescription of either DPP4i or SU
Using this instrument, the authors conducted the LIV estimate as follows:
…the first stage models estimated the probability that each person was prescribed DDP4i given their baseline covariates and their CCG’s TTP. The second‐stage outcome models then included the predicted probabilities from the first‐stage (propensity score) models, covariates and their interactions. Probit regression models were used to estimate the initial propensity score (first stage), while generalised linear models were applied to the outcome data, with the most appropriate family (gaussian) and link function (identity) chosen according to root mean squared error, with Hosmer‐Lemeshow and Pregibon tests also used to check model fit and appropriateness.
Using this approach the authors found the following:
The IV was the clinical commissioning groups (CCG)’s tendency to prescribe (TTP) DPP4i as second‐line treatment. Over the study time‐frame, general practitioners (GPs) worked within a CCG which informed health funding decisions for its respective geographic region. For example, some CCGs tended to recommend –to their affiliated GPs– the prescription of either DPP4i or SU as second‐line treatment.
The authors
use this approach and find that:
The estimated ATEs for the ‘RCT‐eligible’ population are similar to those from a published RCT. The estimated CATEs are in the same direction for the subpopulations included versus excluded from the RCT, but differ in magnitude. The variation in the estimated individual treatment effects is greater across the broader sample of people who do not meet the RCT inclusion criteria than for those who do.
The graphs show the results overall for RCT eligible and ineligible as well as for the specific subgroups of interest.
https://pubmed.ncbi.nlm.nih.gov/39327529/
 https://pubmed.ncbi.nlm.nih.gov/39327529/
Learning Point
What are the 4 conditions for a valid instrument must meet? The authors describe these as follows.
First, the instrument must predict the treatment prescribed…Second, the instrument must be independent of unmeasured covariates that predict the outcomes of interest, which can be partially evaluated through its relationship with measured covariates…Third, the instrument must have an effect on the outcomes only through the treatment received…Fourth, we assume that the average treatment choice must increase or decrease monotonically with the level of the IV.


