Analyse the catastrophe bond maturity schedule, see when liquidity is coming

Catastrophe bond maturities are a significant source of liquidity and cash for the market, which is typically reinvested into new cat bond issues and as such the schedule of upcoming cat bond maturities is a key indicator for sponsors and broker-dealers, as well as cat bond investment fund managers.
To help our readers understand what is coming, we’ve added a new interactive chart to our suite of catastrophe bond and insurance-linked securities (ILS) data visualisations and analytical tools.
Now, with Artemis, you can view and analyse the upcoming catastrophe bond maturity schedule by quarter and by month, to help in your decision-making and to better-inform market timing.
As the catastrophe bond market has grown over recent years, there are periods of scheduled cat bond maturity where a significant amount of risk capital will be freed up, get returned to investors and cat bond asset managers, needing to be redeployed where issuance levels allow.
This is both important for investors and fund managers to keep watch of, so that they time new investor inflows with periods of strong maturities in mind, as well as for those sponsoring and bringing new cat bonds to the market.
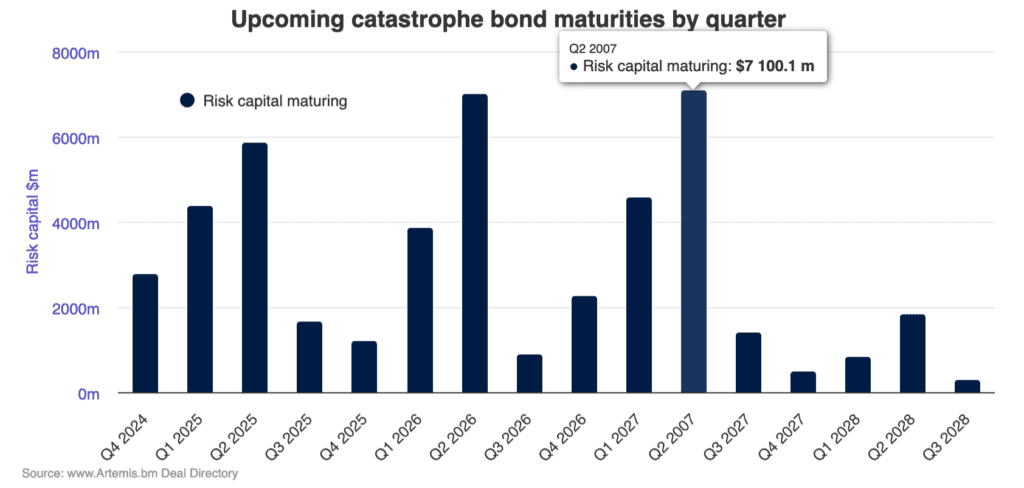
In fact, Artemis’ data, which you can see above and can be analysed using our new interactive chart here, shows that thanks to growing issuance the second-quarter cat bond maturity load is becoming really quite significant.
This is because Q2 has always been one of the busiest quarters for catastrophe bond issuance and as the market’s activity level has increased, so too does the forward-maturity schedule for that period with the majority of deals being a certain number of fixed calendar years in length.
Which is why, as our catastrophe bond maturities chart shows, Q2 2025 sees over $5.8 billion of cat bond maturities scheduled, but Q2 of 2026 and 2027 both see over $7 billion each.
The peak month for upcoming catastrophe bond maturities is currently June 2026, with just over $4.4 billion of cat bonds scheduled to mature in it.
Periods of significant cat bond maturities can result in some spread compression, as cat bond fund managers and investors look to put cash back to work.
They can also result in new issuances becoming oversubscribed more often, making for attractive periods of issuance conditions for sponsors to enter the market with a new deal, hoping for stronger execution as investors and fund managers seek to put their liquidity back into the market.
As cat bond issuance increases and so too we get larger bursts of maturities, the ability of the market to recycle cash into new deals and via the secondary cat bond market trading desks becomes increasingly important.
Efficiently and effectively recycling capital is an important component of the role of an ILS fund manager.
Some might say, it can be simpler to recycle capital from maturing deals in the catastrophe bond market, where there is secondary liquidity and issuances (renewals) most of the way through the year, than in the traditional reinsurance and retrocession market where activity remains so focused on just a handful of key renewal dates.
We hope our new chart displaying the forward-schedule for catastrophe bond market maturities proves helpful and we’ll update it with every issuance and maturity, to keep the data accurate and fresh for our readers.
The Artemis Deal Directory lists all catastrophe bond and related transactions completed since the market was formed in the late 1990’s. The directory also lists the cat bonds waiting to settle, which are highlighted in green at the top of the list.
Analyse the catastrophe bond market using our charts and visualisations, which are kept up-to-date as every new transaction settles.
Download our free quarterly catastrophe bond market reports.
We track catastrophe bond and related ILS issuance data, the most prolific sponsors in the market, most active structuring and bookrunning banks and brokers, which risk modellers feature in cat bonds most frequently, plus much more.
Find all of our charts and data here, or via the Artemis Dashboard which provides a handy one-page view of cat bond market metrics.
All of these charts and visualisations are updated as soon as a new cat bond issuance is completed, or as older issuances mature.


