The Variation in Some Annuity Payouts Has Exploded

Single premium immediate annuities (SPIAs) can provide retirees with an incredibly valuable way to generate guaranteed lifetime income. Payout rates, which represent the annual income divided by the premium, vary both across insurance providers and over time.
There are a number of different components that insurers consider when determining the respective payout rate for SPIA, such as the current interest rate environment, general mortality assumptions, the focus on generating new business, etc. Since each insurer approaches these considerations differently, there is likely to be a variation in the quotes available.
Based on a dataset of both current and historical quotes from CANNEX, a company that supports the exchange of pricing information for annuity and bank products across North America, we recently conducted an analysis exploring the variation in payout rates.
Unlike for a much broader analysis set, in this piece we focus on life-only SPIAs for a 65-year-old male annuitant from March 3, 2013 to July 10, 2022. The data set consists of bi-weekly quotes from the participating insurers.
The exhibit below provides insight into how the payout rates have evolved over the period of analysis. The minimum average payout rate among those available was 5.53% on Aug. 16, 2020, and the maximum average payout was 6.87% on Sept. 29, 2013.
As of July 10, 2022, the average payout was 6.65%. We’ve also included the yield on Moody’s Seasoned Aaa Corporate Bond Yield for reference purposes.
The variation in quotes has changed over time but is highly correlated to interest rates, with a full period correlation of 0.96. There hasn’t really been any relationship between the level of variation and interest rates over the period, especially before 2022 (i.e., the range between the maximum and minimum quotes hasn’t really been higher or lower).
As we demonstrate in the next exhibit, though, the recent rise in interest rates has led to a dramatic increase in the range of payout rates (i.e., dividing the maximum payout by the minimum payout) that is unprecedented over the period of the analysis.
This phenomenon has been noted previously in research by Narat Charupat, Mark J. Kamstra, and Moshe A. Milevsky (2016) , which found some insurers slower to react to the change in interest rates than others.
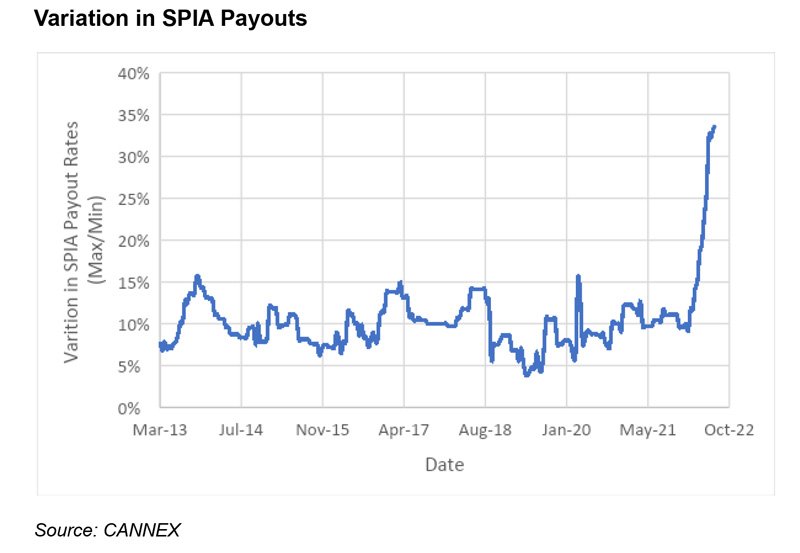
The median and average variability over the entire period has been approximately 10%; however, the variation was 33.7% on July 10, 2022, which is more than three times the historical average, with a minimum payout rate of 5.5% and a maximum payout rate of 7.35%.


