The 5 Highest-Population States' Current COVID-19 Mortality Picture

Early signs suggest that the current U.S. COVID-19 surge could be more deadly than the catastrophic surge that swept the country in the fall.
The total number of U.S. COVID-19 deaths reported in the federal government’s COVID-19 Community Profile Report increased to 16,565 in the week ending Feb. 1.
That’s up 74.5%, from 9,492, for the week ending Sept. 14, 2021, which was the deadliest week of the fall surge.
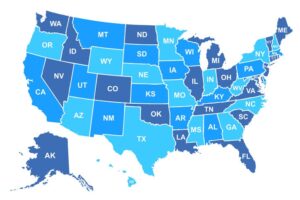
For a look at changes in the number of COVID-19 deaths between the week ending Sept. 14, 2021, and the week ending Feb. 1 in the five highest-population states, see the gallery above.
For data on all 50 states and the District of Columbia, see the chart below.
The Mortality Backdrop
Life insurers had hoped that vaccination campaigns, social distancing efforts and the effects of past COVID-19 infections on people’s immune systems would start to reduce the impact of the pandemic on people with commercial life insurance and other commercial insurance products.
While the fall 2021 surge was underway, information about deaths and life insurance claims emerged slowly. Some life insurers suggested that the fall surge seemed to be spiking hard but ending quickly.
Now, Unum Group, Lincoln Financial, MetLife and other life insurers are saying that the fall surge did cause big increases in the ratio of death benefits to life insurance premiums. At Unum, for example, the ratio increased to 98.3% in the latest quarter, from 71.7% in the fourth quarter of 2019, before the pandemic began.
But those insurers have generally reported strong profits, despite the effects of the pandemic, because of the strong performance of annuities, non-life employee benefits units and other operations.
Data Limitations
The federal government depends on states to report COVID-19 data and other death data.
Factors other than the actual number of deaths that could affect the death statistics include state enthusiasm about death reporting, changes in state cause-of-death assignment rules, and changes in how physicians go about assigning causes of death and reporting deaths.
In some cases, for example, big surges in deaths could overwhelm the people and organizations responsible for reporting deaths.
The final number of total deaths caused by a surge depends on how long the surge lasts as well as the intensity of the surge in the peak week.
The Community Profile Reports do not provide breakdowns of deaths by age, income or other measures, and it’s possible that the current surge could cause a much bigger impact on mortality in the general population than in the insured population.
COVID-19 Deaths: The Current Surge Versus the Fall Surge
Week Ending Sept. 14, 2021
Week Ending Feb. 1, 2022
Change Between September Peak and Week Ending Feb. 1
Alabama
121
135
+11.6%
Alaska
14
13
-7.1%
Arizona
251
721
+187.3%
Arkansas
226
111
-50.9%
California
144
1264
+777.8%
Colorado
94
231
+145.7%
Connecticut
51
303
+494.1%
Delaware
11
55
+400.0%
District of Columbia
4
12
+200.0%
Florida
105
66
-37.1%
Georgia
686
565
-17.6%
Hawaii
33
34
+3.0%
Idaho
94
80
-14.9%
Illinois
311
911
+192.9%
Indiana
317
559
+76.3%
Iowa
94
156
+66.0%
Kansas
95
200
+110.5%
Kentucky
44
14
-68.2%
Louisiana
462
268
-42.0%
Maine
30
43
+43.3%
Maryland
102
299
+193.1%
Massachusetts
95
495
+421.1%
Michigan
89
342
+284.3%
Minnesota
45
237
+426.7%
Mississippi
222
218
-1.8%
Missouri
208
438
+110.6%
Montana
33
29
-12.1%
Nebraska
12
73
+508.3%
Nevada
159
215
+35.2%
New Hampshire
18
53
+194.4%
New Jersey
123
607
+393.5%
New Mexico
16
156
+875.0%
New York
238
1133
+376.1%
North Carolina
411
482
+17.3%
North Dakota
13
29
+123.1%
Ohio
245
1048
+327.8%
Oklahoma
272
149
-45.2%
Oregon
164
130
-20.7%
Pennsylvania
243
1087
+347.3%
Puerto Rico
95
133
+40.0%
Rhode Island
25
59
+136.0%
South Carolina
265
367
+38.5%
South Dakota
18
51
+183.3%
Tennessee
416
521
+25.2%
Texas
1959
1302
-33.5%
Utah
67
65
-3.0%
Vermont
9
18
+100.0%
Virginia
193
358
+85.5%
Washington
292
236
-19.2%
West Virginia
110
128
+16.4%
Wisconsin
109
341
+212.8%
Wyoming
39
25
-35.9%
TOTAL
9,492
16,565
+74.5%
MEDIAN
+80.9%
..
(Image: rsvzarvas)


